> ## Documentation Index
> Fetch the complete documentation index at: https://docs.make-pretty.com/llms.txt
> Use this file to discover all available pages before exploring further.
# Maps
> Insert countries, regions, blocs and administrative subdivisions as editable freeform region shapes, with city dots, labels and legends.
Countries, regions, economic blocs and administrative subdivisions come in as **native editable
freeform region shapes**, grouped together on the slide.
Each district, state or département is its own shape, so you can:
* recolour a single region without touching its neighbours,
* shade a set of regions by a metric and build a real legend from them,
* delete, nudge or relabel one region,
* hand the deck to someone who has never used Pretty and let them edit it in plain PowerPoint.
## Finding a map
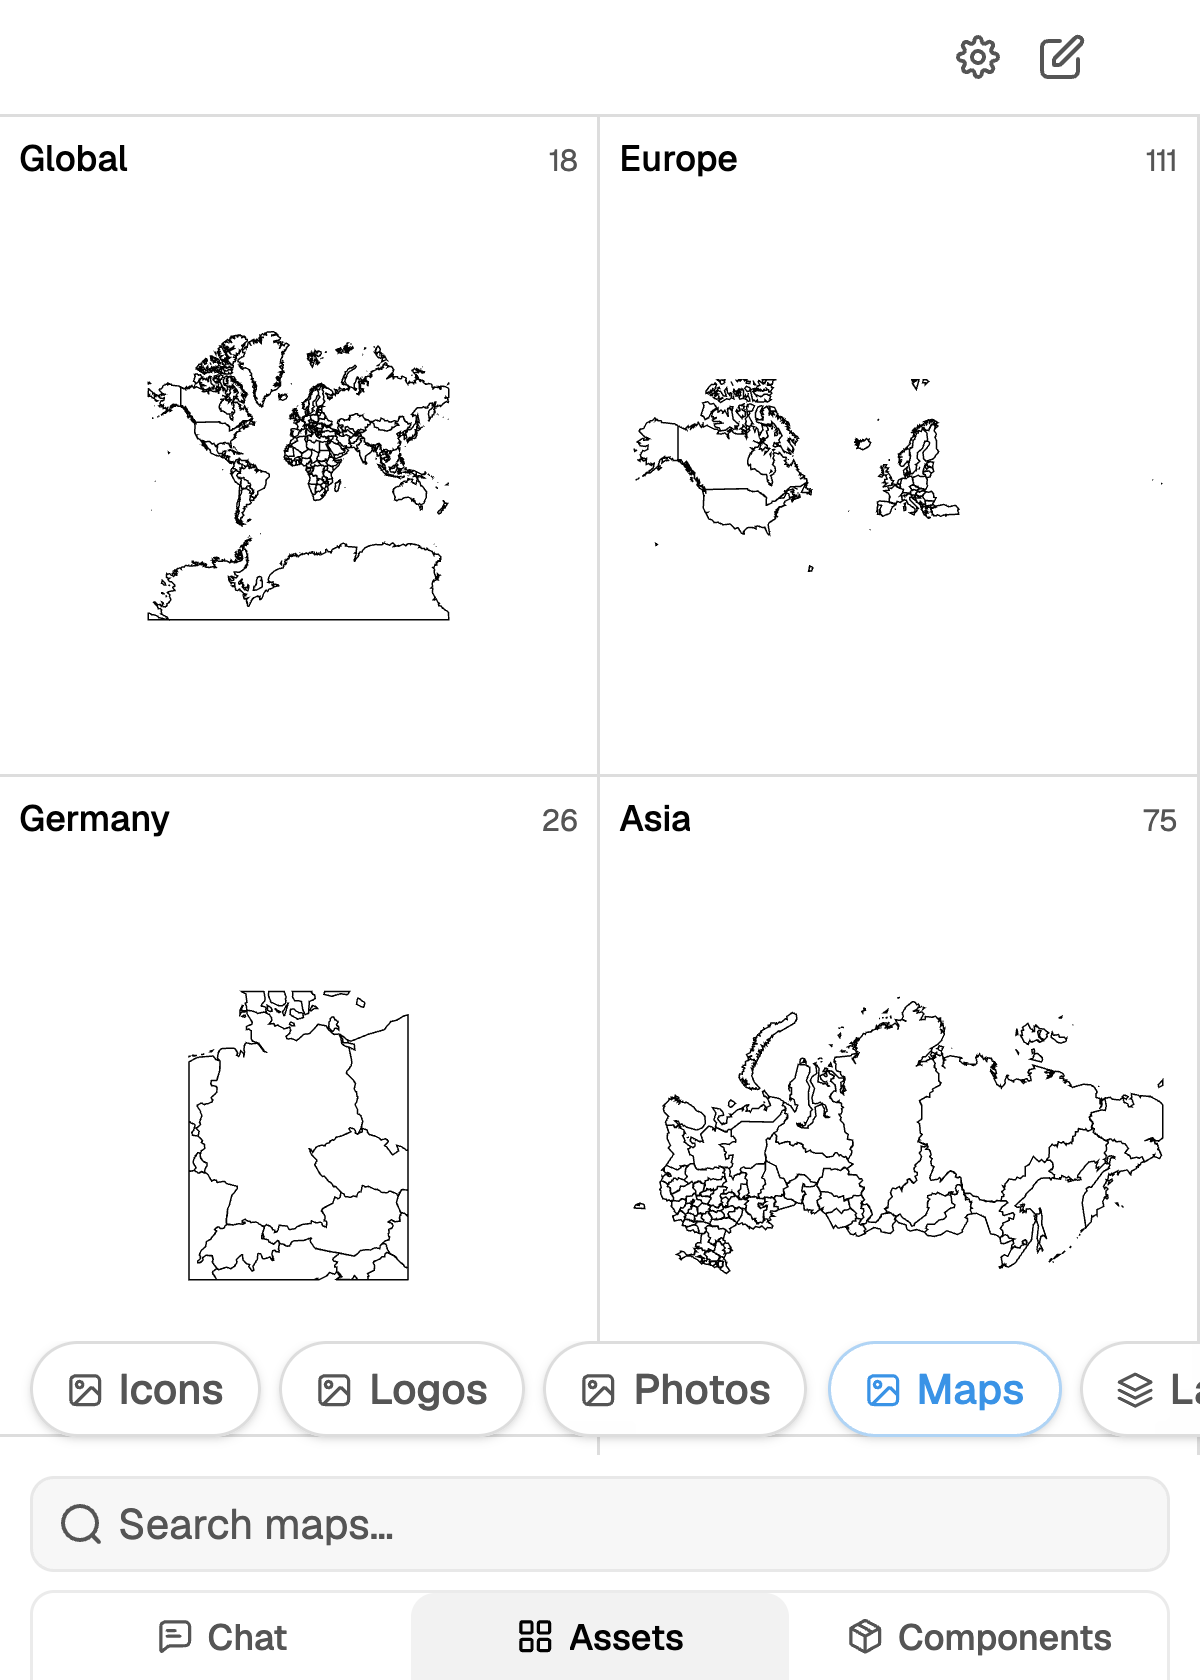
Open the **Assets** tab and pick **Maps**. The library opens on regions; drill into one, or type
into `Search maps…`.
 | Search for | Example |
| ----------------------------- | ---------------------------------------------------- |
| A country | `japan` |
| An administrative level | `germany states`, `us states`, `france départements` |
| An economic or political bloc | `european union`, `g7`, `nato` |
| A named region | `nordics`, `balkans`, `DACH` |
Each result carries a short description and roughly how many regions it contains, which is usually
the fastest way to tell two similar presets apart.
You can also just ask in chat. The agent runs a **Find map** step, ranks the presets and inserts the
one that fits your slide. The shapes it places are the same editable freeforms.
## Map settings
Open **Map settings** from the picker header. The panel is titled **Map defaults**
(*"Applied to every map you insert"*), so what you set here carries to the next map, and the one
after that.
| Search for | Example |
| ----------------------------- | ---------------------------------------------------- |
| A country | `japan` |
| An administrative level | `germany states`, `us states`, `france départements` |
| An economic or political bloc | `european union`, `g7`, `nato` |
| A named region | `nordics`, `balkans`, `DACH` |
Each result carries a short description and roughly how many regions it contains, which is usually
the fastest way to tell two similar presets apart.
You can also just ask in chat. The agent runs a **Find map** step, ranks the presets and inserts the
one that fits your slide. The shapes it places are the same editable freeforms.
## Map settings
Open **Map settings** from the picker header. The panel is titled **Map defaults**
(*"Applied to every map you insert"*), so what you set here carries to the next map, and the one
after that.
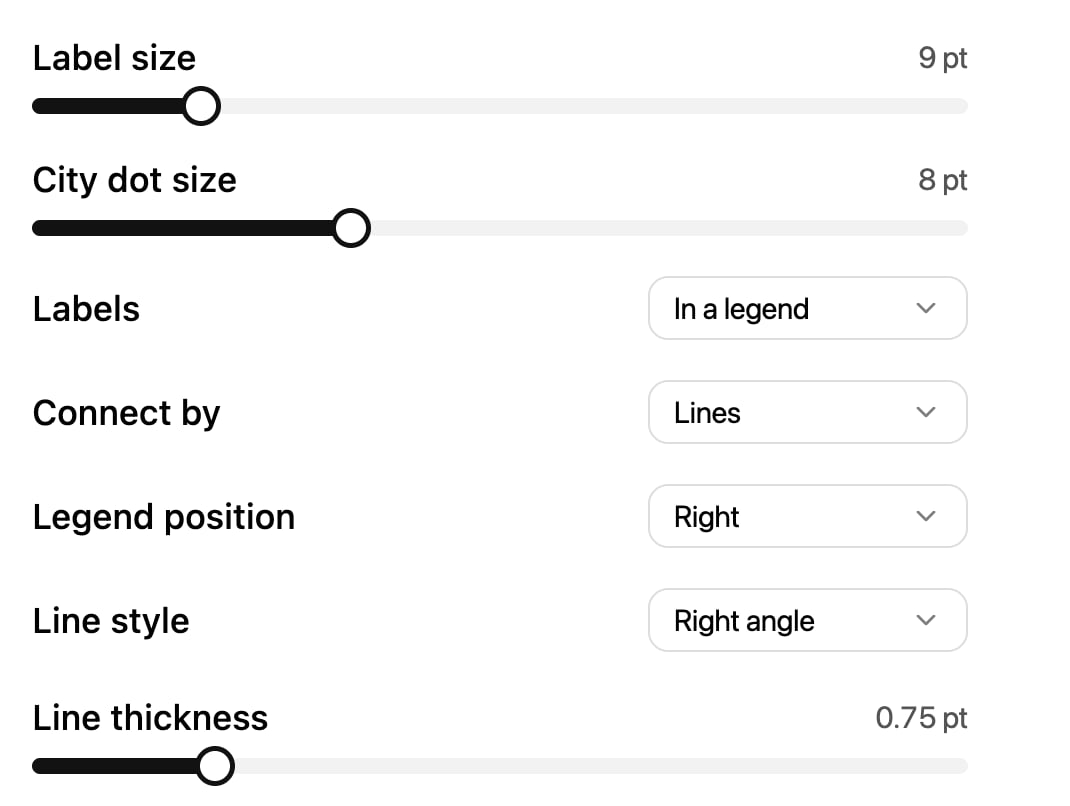 **Labels** decides whether city names sit next to their dots (**On the map**) or collect into a
list beside them (**In a legend**). **Connect by** ties a legend row back to its dot with a
**Number** or a **Line**.
**Line style** and **Line thickness** only appear when leader lines can be drawn: when **Labels**
is **On the map** (where a label pushed off its dot gets a leader), or when **Connect by** is set
to **Lines**.
Open the same panel from inside a map you are configuring and it reads
*"Only this map — your defaults stay unchanged"*. Use that when one slide needs a bigger legend
than the rest of the deck.
## Choose cities
Picking a map opens the **Choose cities** step before anything lands on the slide.
Type into `Search cities...`. Each row shows the city, its country and its population, so you
can tell one Springfield from the other.
Tick as many as you need. The header keeps a running count, and the list loads more as you
scroll.
The button reads `Insert ({{count}})` with the number you have ticked. Insert with none selected
to get the region shapes on their own.
## Recipes
Insert the admin-level map for the country (`germany states`, `us states`) with no cities.
Then click a region and set its fill. Because every region is a separate shape, a five-step
colour scale is five fills, and the legend is five rectangles with the same fills. Or ask the
agent to do it in one go: "shade the states by the revenue in this table, darkest for the
highest".
Set **Labels** to **In a legend**, **Connect by** to **Numbers**, and **Legend position** to
**Right**. Then pick your offices in **Choose cities**. Each dot gets a number and the legend
lists them in order, which keeps a crowded map readable where on-map labels cannot.
Leave **Labels** on **On the map**, keep **City dot size** small, and pick three or four cities.
Where a label would collide with its dot, a leader line appears. Set **Line style** to
**Right angle** for a technical look, **Straight** for a lighter one.
Search the bloc directly (`european union`, `nato`) rather than assembling countries by hand.
Then recolour the two or three member states you are actually talking about and leave the rest
in a muted theme tone.
## Editing after insertion
Everything is a normal PowerPoint shape, so the usual tools apply: select a region, set a fill, add
an outline, send it behind a callout. For anything fiddlier, select the shapes and describe the
change in chat. The agent picks up what you have selected and edits those shapes.
Maps are wide. Insert one before you write the surrounding copy, so the text block is sized to
the space that is actually left.
**Labels** decides whether city names sit next to their dots (**On the map**) or collect into a
list beside them (**In a legend**). **Connect by** ties a legend row back to its dot with a
**Number** or a **Line**.
**Line style** and **Line thickness** only appear when leader lines can be drawn: when **Labels**
is **On the map** (where a label pushed off its dot gets a leader), or when **Connect by** is set
to **Lines**.
Open the same panel from inside a map you are configuring and it reads
*"Only this map — your defaults stay unchanged"*. Use that when one slide needs a bigger legend
than the rest of the deck.
## Choose cities
Picking a map opens the **Choose cities** step before anything lands on the slide.
Type into `Search cities...`. Each row shows the city, its country and its population, so you
can tell one Springfield from the other.
Tick as many as you need. The header keeps a running count, and the list loads more as you
scroll.
The button reads `Insert ({{count}})` with the number you have ticked. Insert with none selected
to get the region shapes on their own.
## Recipes
Insert the admin-level map for the country (`germany states`, `us states`) with no cities.
Then click a region and set its fill. Because every region is a separate shape, a five-step
colour scale is five fills, and the legend is five rectangles with the same fills. Or ask the
agent to do it in one go: "shade the states by the revenue in this table, darkest for the
highest".
Set **Labels** to **In a legend**, **Connect by** to **Numbers**, and **Legend position** to
**Right**. Then pick your offices in **Choose cities**. Each dot gets a number and the legend
lists them in order, which keeps a crowded map readable where on-map labels cannot.
Leave **Labels** on **On the map**, keep **City dot size** small, and pick three or four cities.
Where a label would collide with its dot, a leader line appears. Set **Line style** to
**Right angle** for a technical look, **Straight** for a lighter one.
Search the bloc directly (`european union`, `nato`) rather than assembling countries by hand.
Then recolour the two or three member states you are actually talking about and leave the rest
in a muted theme tone.
## Editing after insertion
Everything is a normal PowerPoint shape, so the usual tools apply: select a region, set a fill, add
an outline, send it behind a callout. For anything fiddlier, select the shapes and describe the
change in chat. The agent picks up what you have selected and edits those shapes.
Maps are wide. Insert one before you write the surrounding copy, so the text block is sized to
the space that is actually left.